OpenEPG show reports (beta)
Beta. The OpenEPG show reports are in beta. Features and coverage may change.
The OpenEPG reports break your ad traffic down by the TV show it ran against. Each row is a show, with the app it ran in, the market and time of day it ran most, its genre, and your gross ad counts and invalid traffic (IVT) for it.
Show-level attribution is Pixalate’s resolution of open-exchange bid stream signals against publicly available electronic program guide (EPG) data. It represents Pixalate’s best determination at the time of the impression. See the OpenEPG™ disclaimer.
Open the reports
In the Analytics dashboard, open the Reports menu and expand Open EPG™. There are two reports:
Both reports work like other Analytics reports: set the date range, filter, add columns, then save, schedule or export. See Run and customize reports.
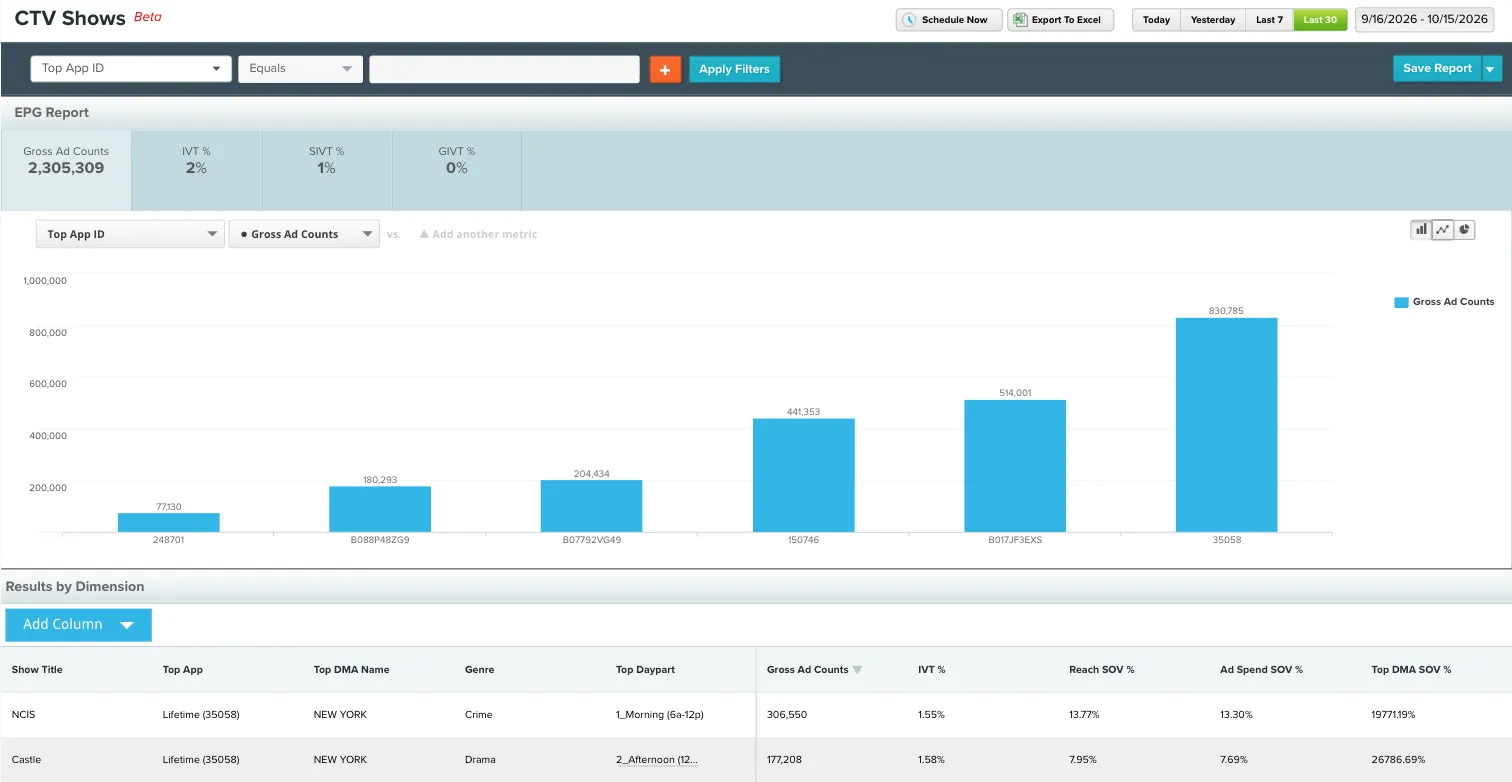
If a report shows no data for Yesterday or Last 7, try Last 30.
Summary tiles
The tiles at the top show Gross Ad Counts, IVT %, SIVT % and GIVT % for the selected date range and filters.
Dimensions
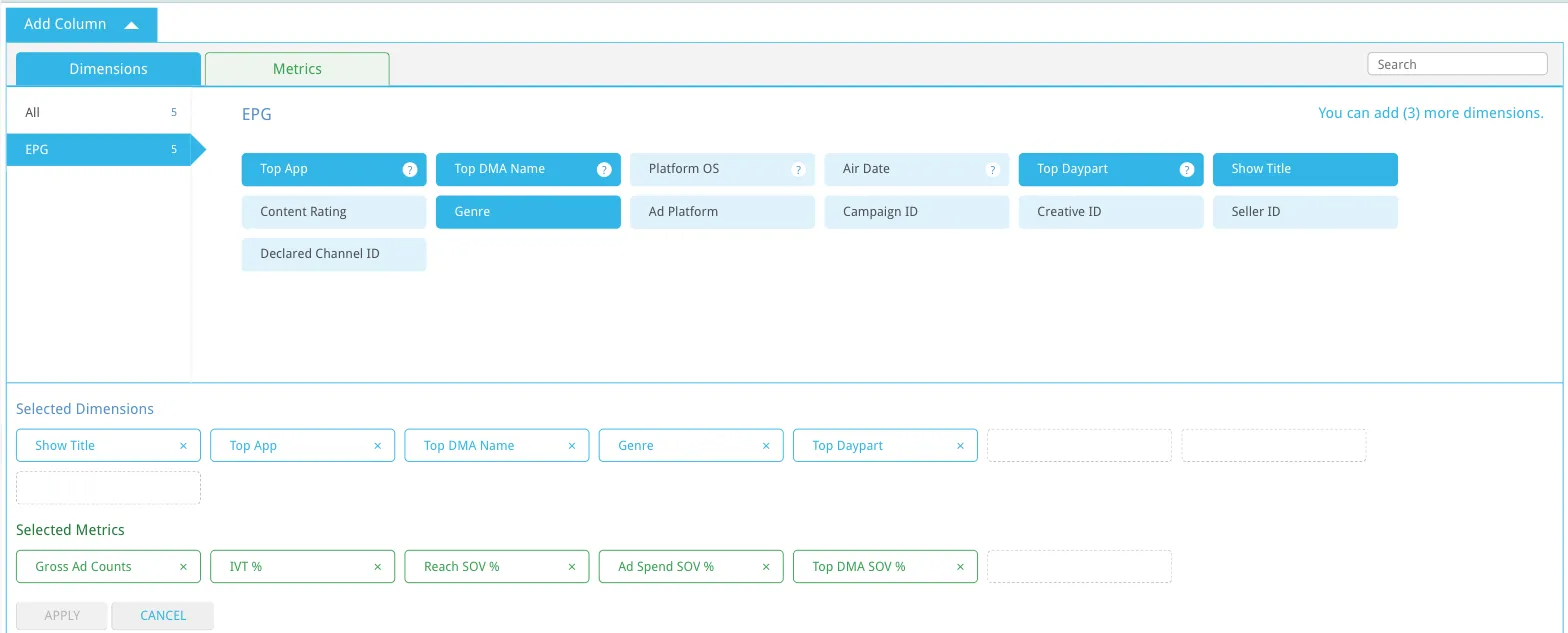
By default each row shows Show Title, Top App, Top DMA Name, Genre and Top Daypart. Add or remove dimensions with Add Column.
Metrics
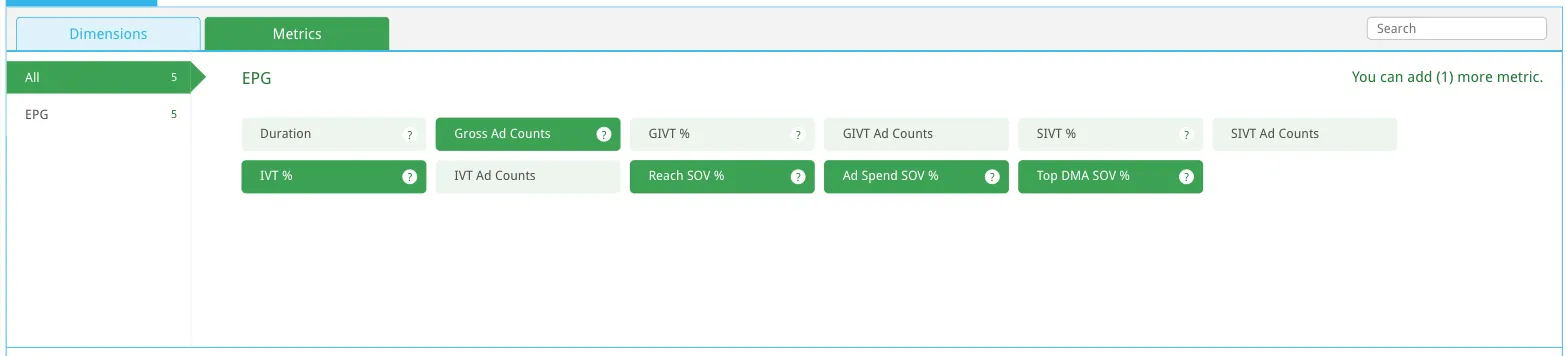
For how IVT is classified, see Reported IVT types and Metrics.
Related
- OpenEPG Index: Pixalate’s monthly rankings of streaming TV shows.
- OpenEPG Enrichment API (preview): resolve CTV ad opportunities to the channel and show being watched.
- Run and customize reports