Seller Trust Index (STI)
The Seller Trust Index (STI) ranks web, mobile and connected TV (CTV) sellers, including supply-side platforms (SSPs), that are listed in ads.txt and app-ads.txt files. Sellers are ranked on how much authorized, direct inventory they control in each country, so you can spot sellers that mostly resell inventory.
This page describes STI 2.0, which replaced STI 1.0 on April 1, 2026.
Video (2.5 min): how the Seller Trust Index ranks sellers and how to read it.
What the STI measures
The STI ranks sellers on the scale of their direct relationships with publishers within each country. It uses the SupplyChain Object (SCO) to get a multidimensional view of ad transactions.
- Rankings are relative to peers within each country. A seller’s position compares it only with other sellers in the same market.
- Rankings use only buy-side data.
- Other traffic signals don’t change the rank. Invalid traffic (IVT), made-for-advertising (MFA) traffic and delisted-app traffic are shown next to each ranking as supplemental data.
Pixalate analyzes more than 30 billion global advertising transactions a month to rank more than 300 sellers across more than 100 countries.
Indexes and coverage
There are three indexes. Each is available by quarter and by country.
The public rankings are on the Seller Trust Index page on pixalate.com.
How sellers are ranked
Sellers are ranked only on a composite index that measures the scale and authorization of their direct inventory relationships in each country. The ranking model looks at:
- What sellers claim: how many publishers that sell ads list the seller as DIRECT in their ads.txt or app-ads.txt file, as detected by Pixalate.
- Verification of seller claims: the scale and ratio of the seller’s impressions that actually flowed through an authorized direct path, according to Pixalate’s SCO analysis.
- Seller arbitrage risk: Pixalate’s independent risk rating for selling more than 50% of inventory as a reseller, according to Pixalate’s SCO analysis.
Final rank
The final rank is a composite score of how much authorized, direct inventory a seller controls in a country. It combines three components:
Supplemental signals
These signals are reported next to each seller’s rank as context for buyers. They don’t affect the rank, and which ones you see depends on the platform.
For the IVT types Pixalate reports, see IVT Taxonomy 2.0.
Read the rankings table
The rankings table in the MRT shows Rank, Seller Name, Risks (badges such as High SIVT and High GIVT), Arbitraged Inventory Ratio, ‘DIRECT’ Publisher Penetration, and the supplemental signals for the platform, such as SIVT Ratio, GIVT Ratio, Delisted App Traffic Ratio and MFA App Traffic Ratio for mobile. CTV rankings have a platform toggle (Roku, Fire TV, Samsung, tvOS and LG TV) and a Fraudulent Bundle ID Traffic Ratio column. Direct Impression Volume is part of the rank but isn’t shown as a column. Select a seller’s name to open its Seller Insights page.
Interpret the rankings
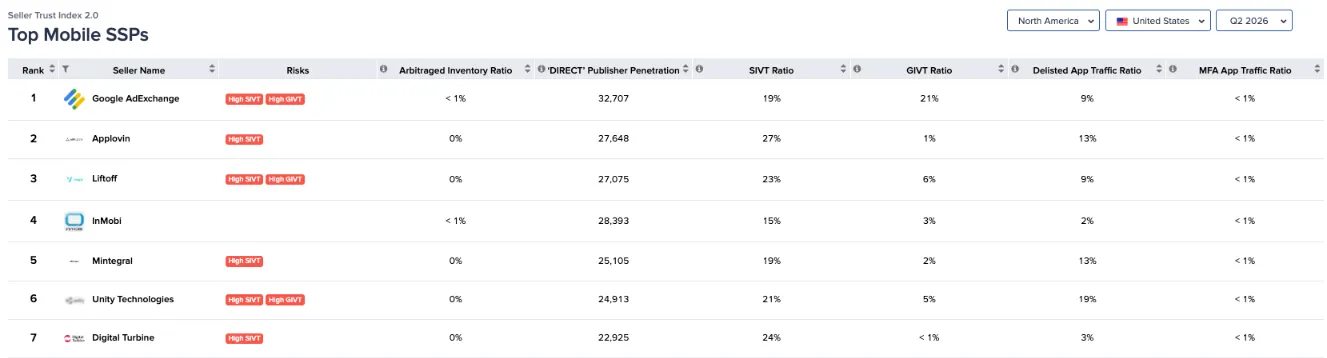
Final rank
A seller’s rank reflects the strength and depth of its direct supply presence in a specific country. A higher rank mainly means the seller:
- Transacts most of its impressions in the country as direct, non-reseller inventory.
- Has a meaningful volume of direct impressions compared with other sellers in that market.
- Holds direct authorization relationships with many local publishers.
A lower rank doesn’t mean the supply isn’t legitimate. Lower-ranked sellers rely more on reseller paths, are authorized by fewer local publishers, or operate at a smaller scale in the country. If you want fewer supply chain hops and direct access to local inventory, favor sellers with higher ranks in the country you buy in.
Review the supplemental signals separately from the rank.
GIVT and SIVT ratios
IVT can show up as proxy usage, app spoofing and high-risk devices. Lower IVT gives buyers more confidence that fraud has been mitigated.
- GIVT is deterministic. Examples include data center IPs, bot activity and duplicate impressions.
- SIVT can include display impression fraud, app spoofing and high-risk devices.
MFA Traffic Ratio
MFA is a risk for both sides of the market. For sellers, it can undermine inventory quality and damage their reputation. For buyers, ads on cluttered MFA sites can make campaigns less effective. See Made for Advertising (MFA).
Delisted App Traffic Ratio
This ratio shows how much of a seller’s traffic runs on delisted apps. Apps are delisted for many reasons: publisher-level fraud, malware, adware, backdoors exploited through bad SDKs, or the developer removing the app. Apps can also be delisted for copyright or policy violations that have nothing to do with fraud. A higher ratio means the seller is more likely to be transacting on riskier apps that aren’t listed in an established app store. See Delisted apps (DEFASE).
Fraudulent Bundle ID Traffic Ratio
Standardized app store IDs reduce fragmentation in CTV and align buyers and sellers on the same inventory format, so buyers can be more confident about what inventory they’re getting. See CTV bundle IDs and Malformed CTV bundle IDs.