Run and customize reports
The Pixalate Analytics dashboard reports on the traffic measured by your Pixalate tags. Every report works the same way: choose a date range, filter and group the data by dimensions, choose the metrics you want, then save, schedule or export the view.
To pull the same data from code instead of the dashboard, use the Analytics Reports API. For what each column means, see Metrics and Dimensions.
Video (1 min): getting around the Analytics dashboard.
Report groups
Reports are grouped in the left navigation under Pre-Set Reports, Reports, Data Feeds and Custom Reports. Which reports you see depends on your account.
Reports for privacy, brand safety, COPPA, MFA and supply chain are covered in Privacy, brand safety and COPPA reports, MFA exposure reporting and Supply chain (SCO) reports.
Data windows can change. If you need data older than a report allows, ask your Pixalate account manager whether a custom retrieval is available.
Set the date range and time zone
- Open a report.
- Pick a reporting period, such as Yesterday, Last 7 or Last 30. Some reports, such as the Clawback Report, also offer Last 60 and Last 90.
- For any other period, use the Date Range picker. The range must fall inside the report’s data window (see the table above).
- Where a report offers it, change the time zone with the UTC, EST and PST buttons at the top right.
Reports use UTC by default.
Filter your traffic
Use the dashboard toolbar to narrow a report to the traffic you care about.
- Select Apply Filters.
- Pick a dimension (for example, Seller ID or Device Type) or a metric, and enter the values to include. The dimensions and metrics you can filter on depend on the report.
- Add as many filters as you need. There’s no limit on the number of dimensions and metrics you can filter on.
Group by dimensions and choose metrics
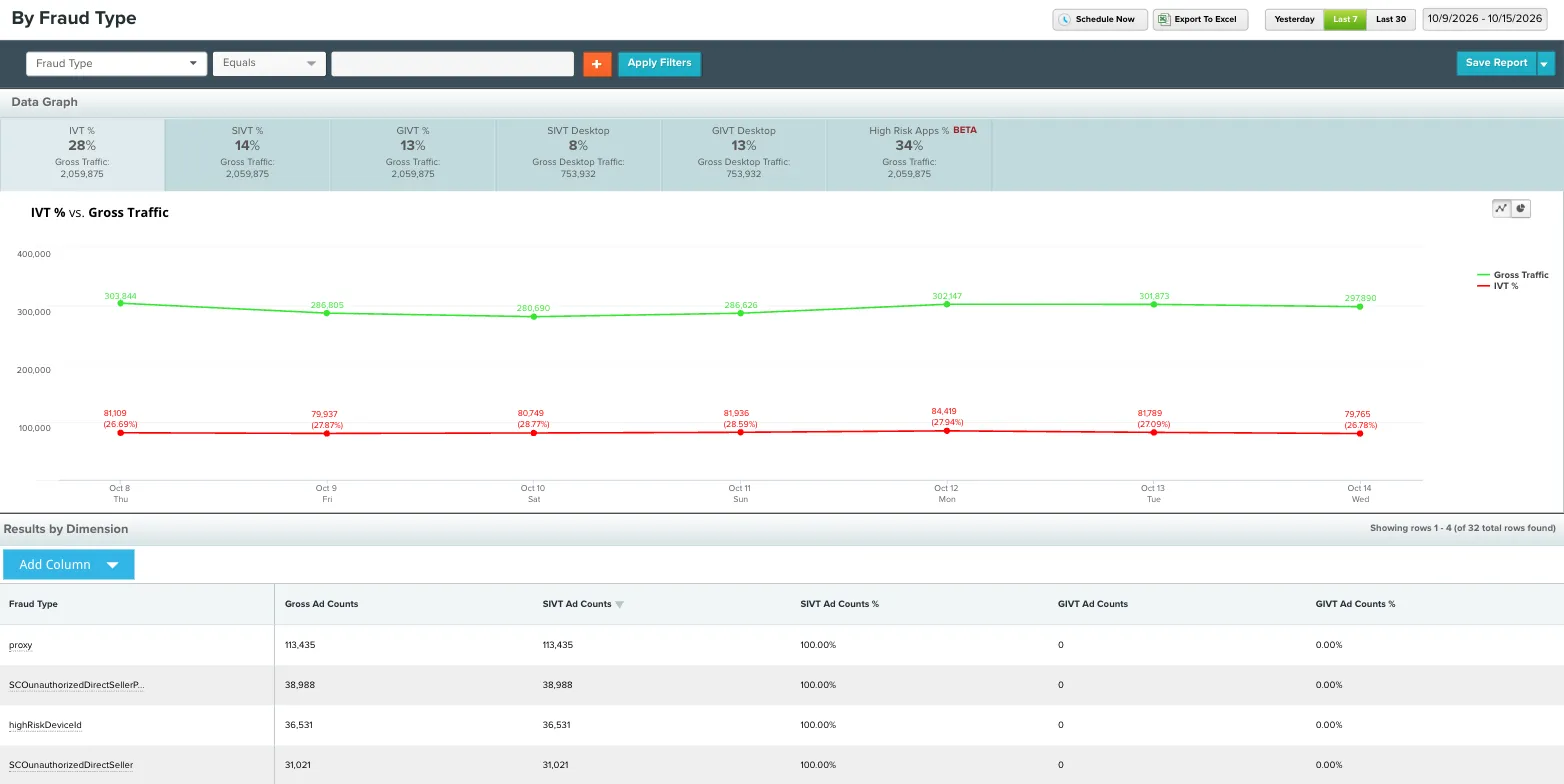
The table under the chart is Results by Dimension. Each row is one combination of the dimensions you choose.
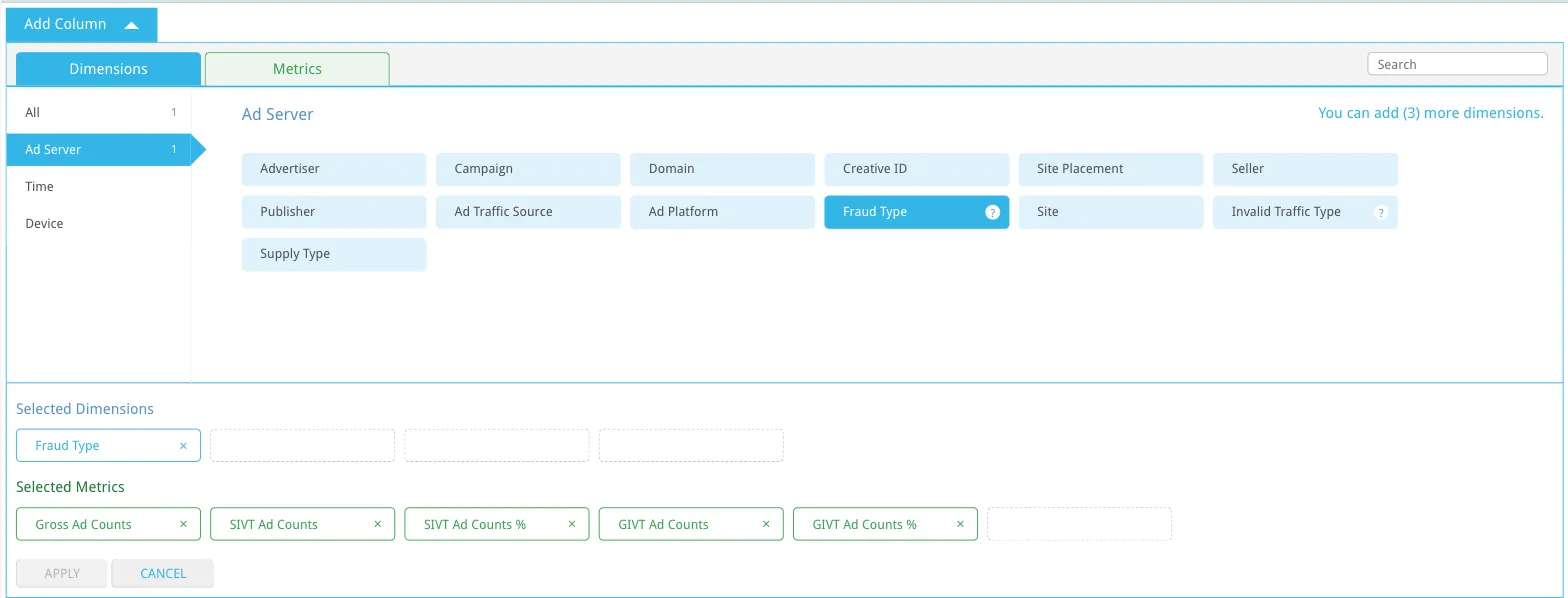
- In Results by Dimension, select Add Column.
- Choose the Dimensions or Metrics tab, then search or browse the groups.
- Select the ones you want and select Apply. Remove a column the same way.
A report view can have up to 4 dimensions and 6 metrics at once.
Dimensions are grouped by type, such as Ad Server, User Location, Device, Publisher, User and Time. Each report offers only the groups that apply to it.
Metrics are reported at several levels of IVT filtering. Not every report offers every level:
For every dimension and metric, with definitions, see Dimensions and Metrics. For the IVT types behind the GIVT and SIVT numbers, see Reported IVT types.
Change the chart
The chart above the table shows the dimensions and metrics you’ve selected. Depending on the report, switch it between a bar graph, line graph and pie chart. Where a report has a line graph over time, you can view it by day or by hour.
Save, schedule and export a report
You can do these from any report. Use the Save Report menu (Save, Save as and Save & Schedule) and the Schedule Now and Export To Excel buttons.
- Save: keeps the current view (date range, filters, dimensions and metrics) so you can open it again. Save as saves it under a new name.
- Schedule Now: emails the report on a daily, weekly or monthly cadence. Scheduled reports can go to any email address, so you can use them for delivery reports, IVT reports and alerts.
- Save & Schedule: does both in one step. Set the report name, the email addresses, the frequency, and whether the schedule is enabled.
- Export To Excel: downloads the current view.
To automate exports, use the Analytics Reports API.
Notes on specific reports
Domains
Shows how your impressions are distributed across individual domains. In the domain map, a darker, larger tile means more impressions; hover over a domain for its numbers. A second chart breaks traffic down by traffic type and ad exposure time.
The Domains report under Reports includes “not set” (null) domain values. The By Domain report under Pre-Set Reports filters them out. If your data has null domains, the two reports show different gross ad counts for the same filters and date range.
Device Types
Shows how your impressions are distributed across device environments: mobile, desktop, tablet, and connected TV (CTV) or over-the-top (OTT). Filter on the Device Type dimension to compare environments over time. For CTV and OTT, see CTV and OTT reporting.
Geolocation
Maps your traffic by country code. Hover over a country for its numbers. The table breaks traffic down by country code.
App Mismatch
Compares the app you declared with the app Pixalate detected.
IPv6 Type
Has the standard dimensions and metrics plus IPv6 Type, which adds a layer for IVT deep dives and for comparing against network-level traffic. See Dimensions.
Related
Questions? Contact support@pixalate.com.